
Focus on a plant, area or equipment group.
NAZARE · Live monitoring
See which machine needs attention now.
Move from plant-wide operating states to individual machine signals. See running, waiting, stopped and alarm conditions together to reduce time spent checking machines in person.
Keep data on siteStart small, expand as needed
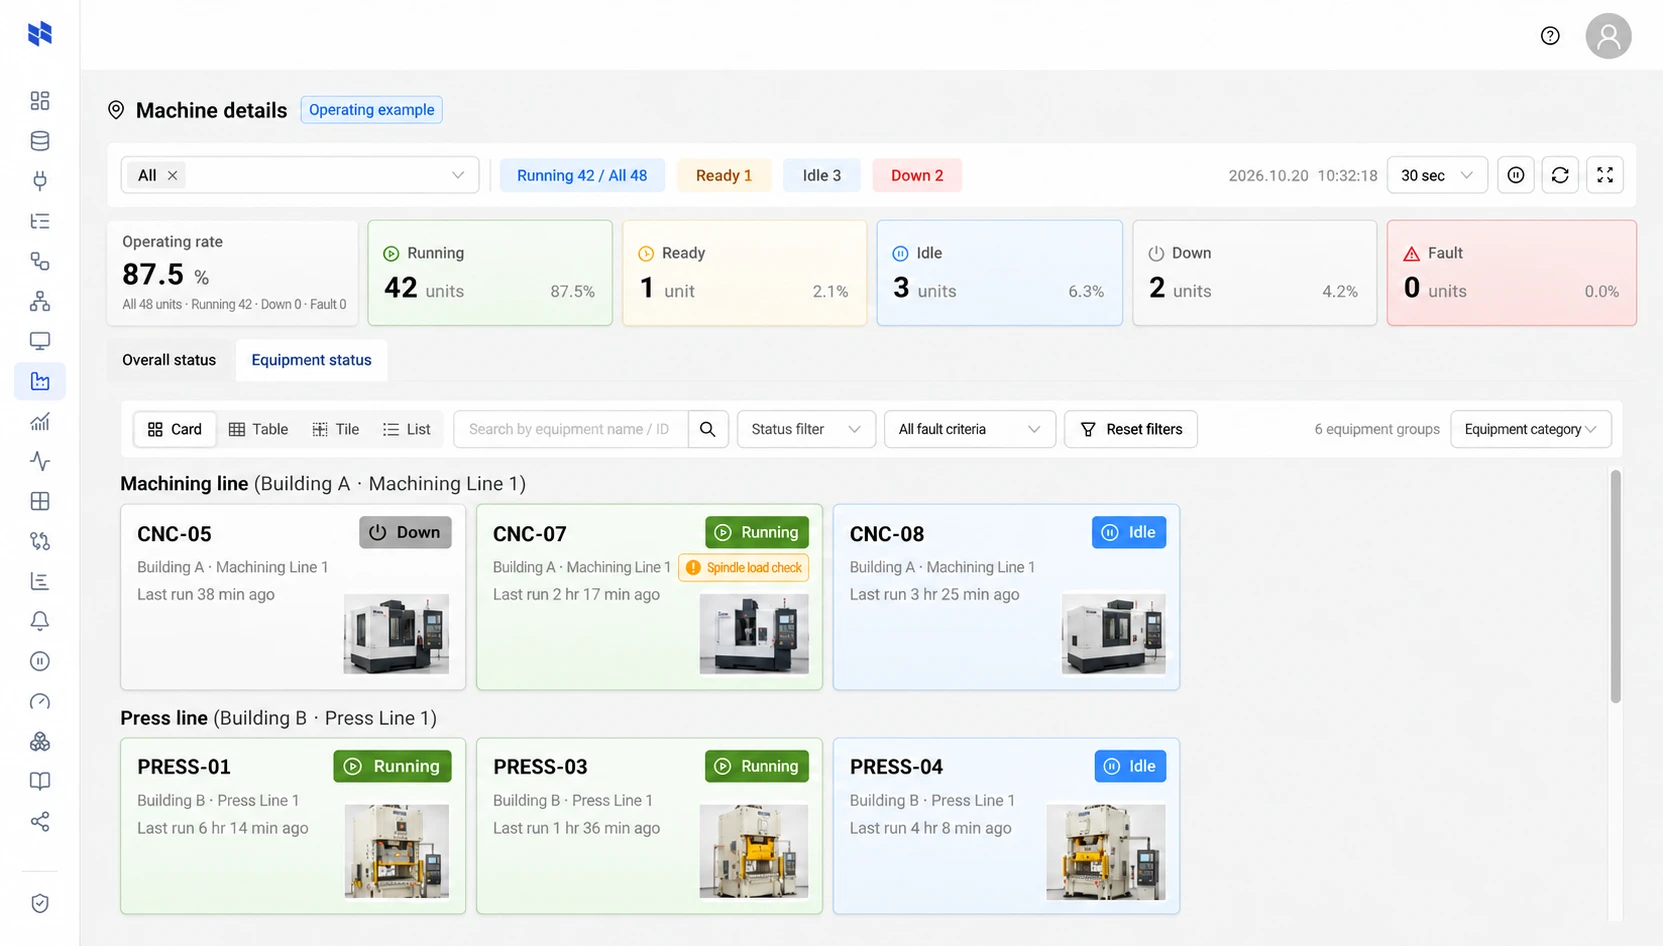
What changes on the shop floor
Live monitoring
Open an equipment card to inspect its state and key signals together.
Set alarms against your operating criteria and retain event history.
NAZARE · Signal trend analysis
See how signals move together, beyond a single number.
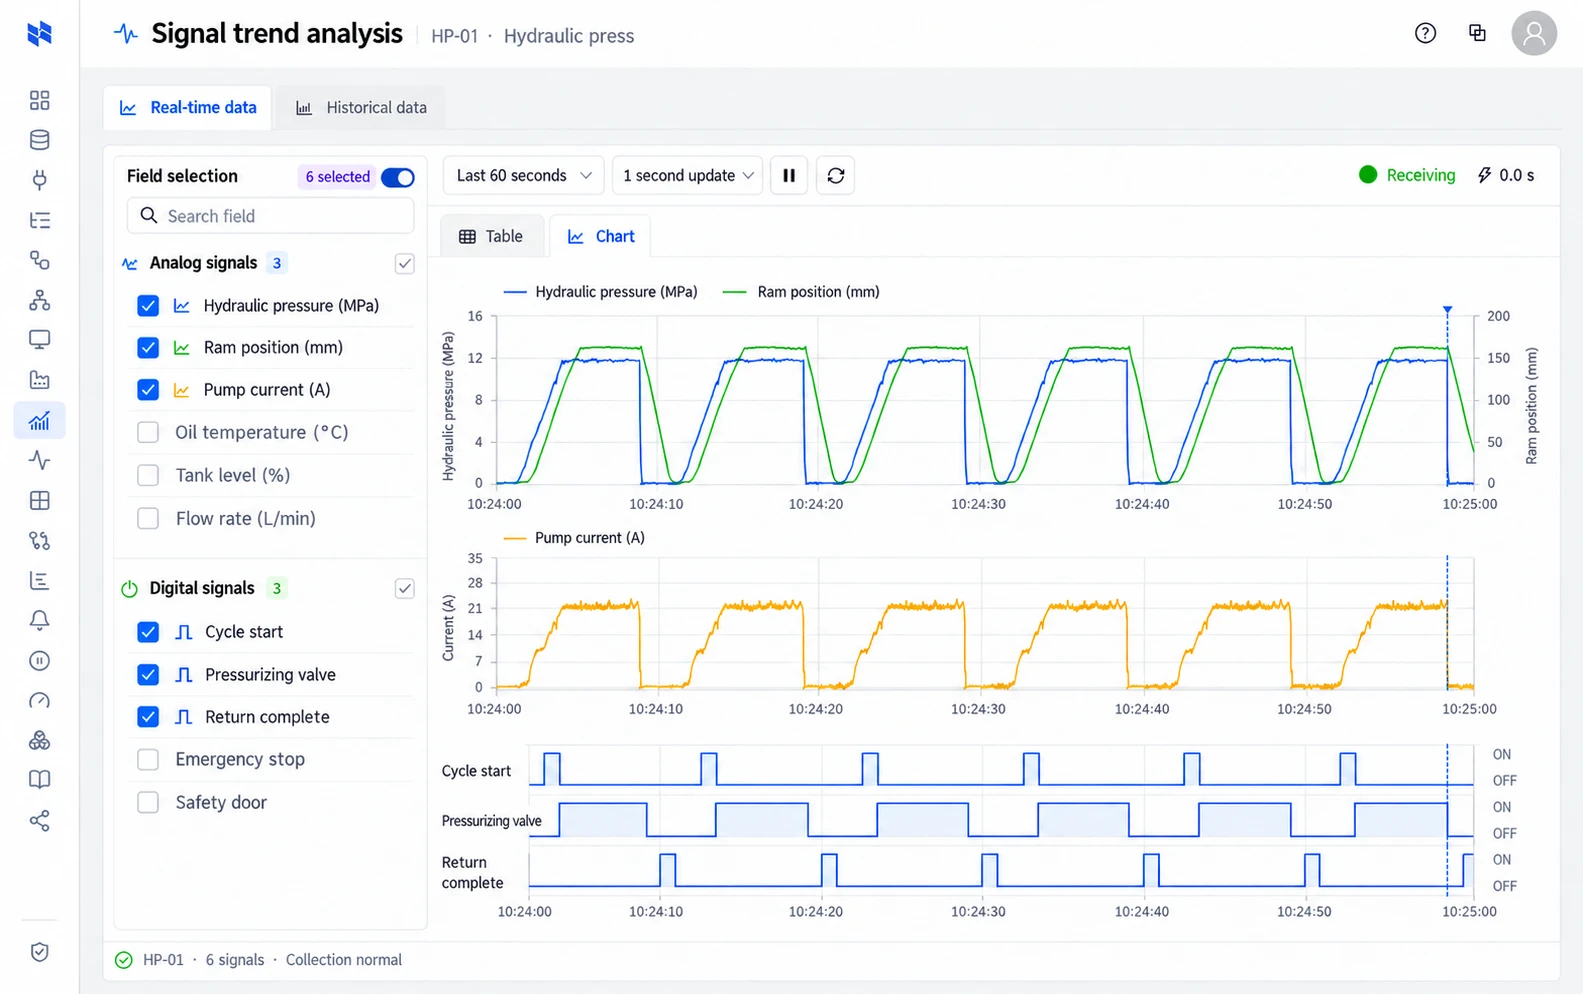
Live trends
Is every cycle following the same pattern?
Display pressure, position and current as analog traces, and contact states such as cycle start and valve operation as digital signals. Align signals on the same time axis to see how pressurization and feedback signals interact in real time.
- Signals grouped by machine
- Analog and digital together
- Repeated production-cycle patterns
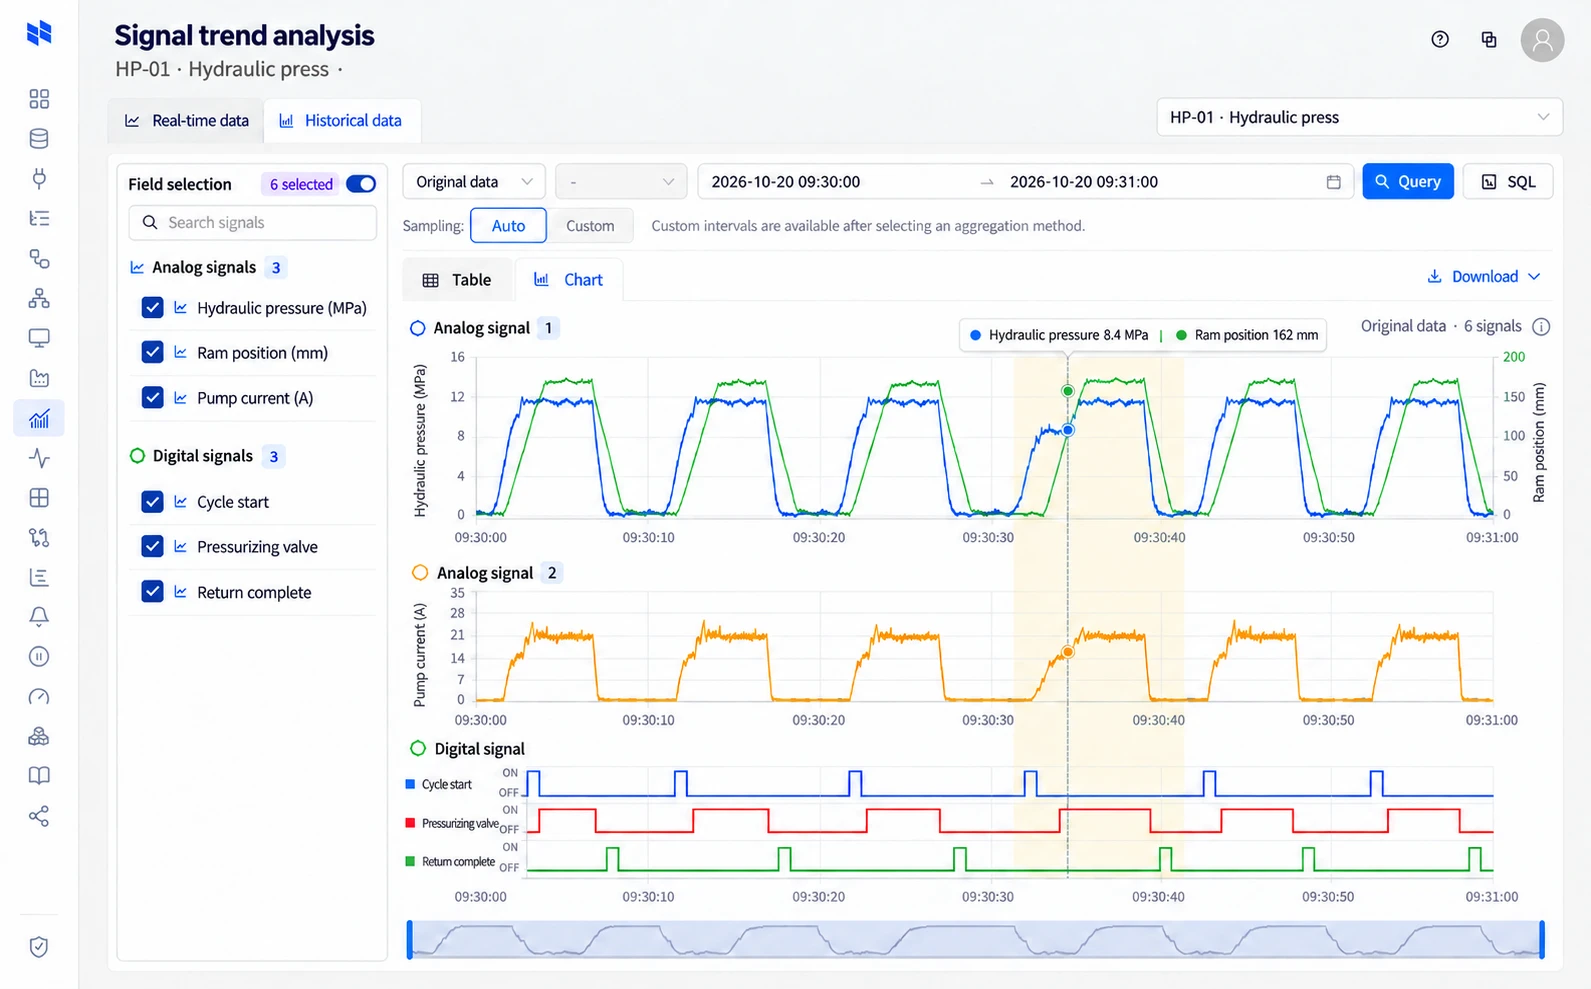
Historical trends
Revisit the signals behind one delayed cycle.
Load stored signals for a machine and time range. Compare when the valve switched with pressure rise and motor current, then zoom into the event to narrow down possible causes.
- History by machine and time range
- Compare signals at the same instant
- Zoom in and inspect original data
NAZARE
Explore the tools behind your daily operations.
From connections and analysis to maintenance and administration: see what each screen helps you do.
Put data to work on the shop floor
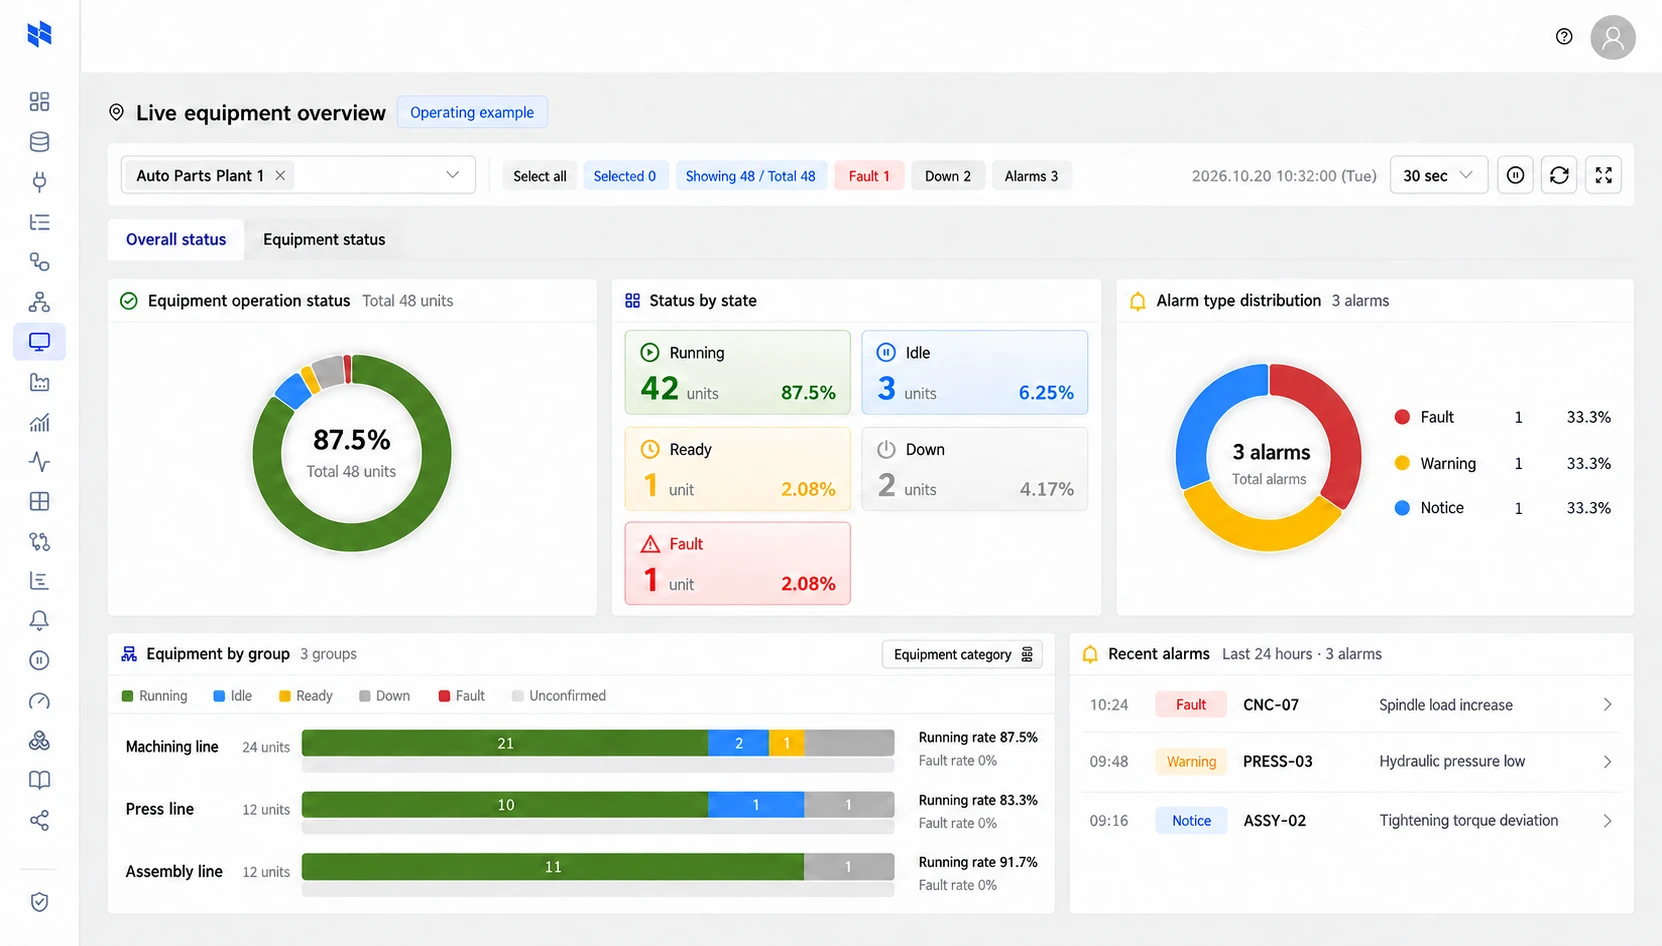
Live equipment status
Know which machine needs attention first
Move from plant status to individual machine signals. Select a machine card to inspect its values and recent trends.
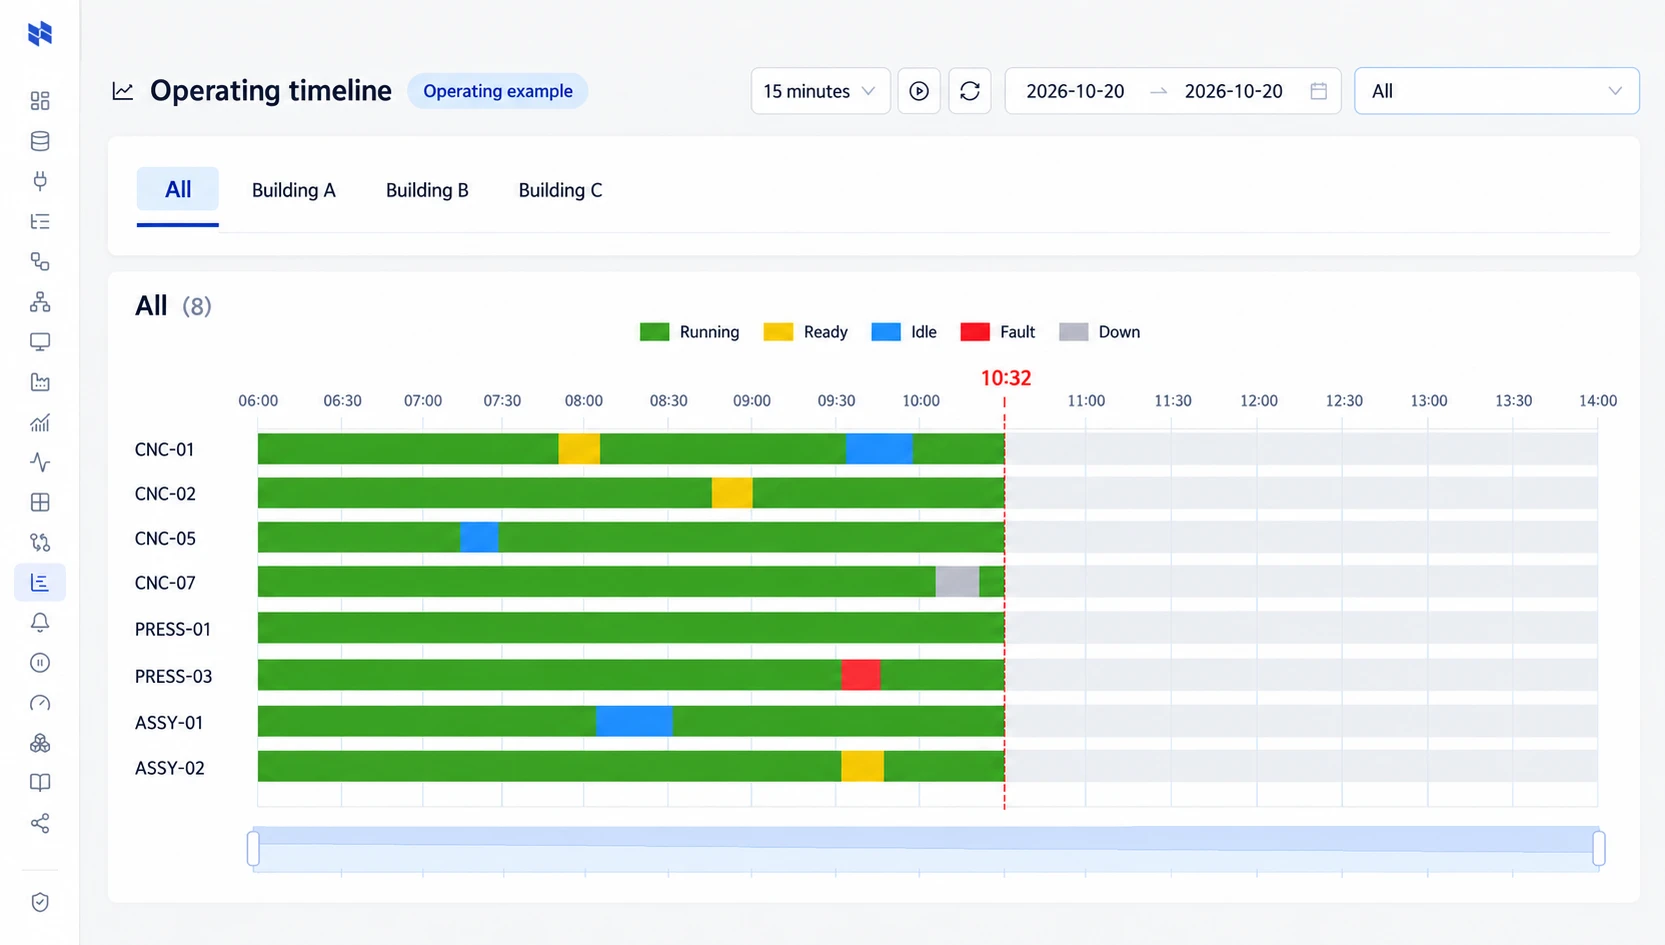
Operating timeline
See run time, anomalies and downtime at a glance
Select a time range to view the operating states of factory equipment on parallel timelines. See how long each machine ran and when abnormal conditions or downtime occurred, including their duration.
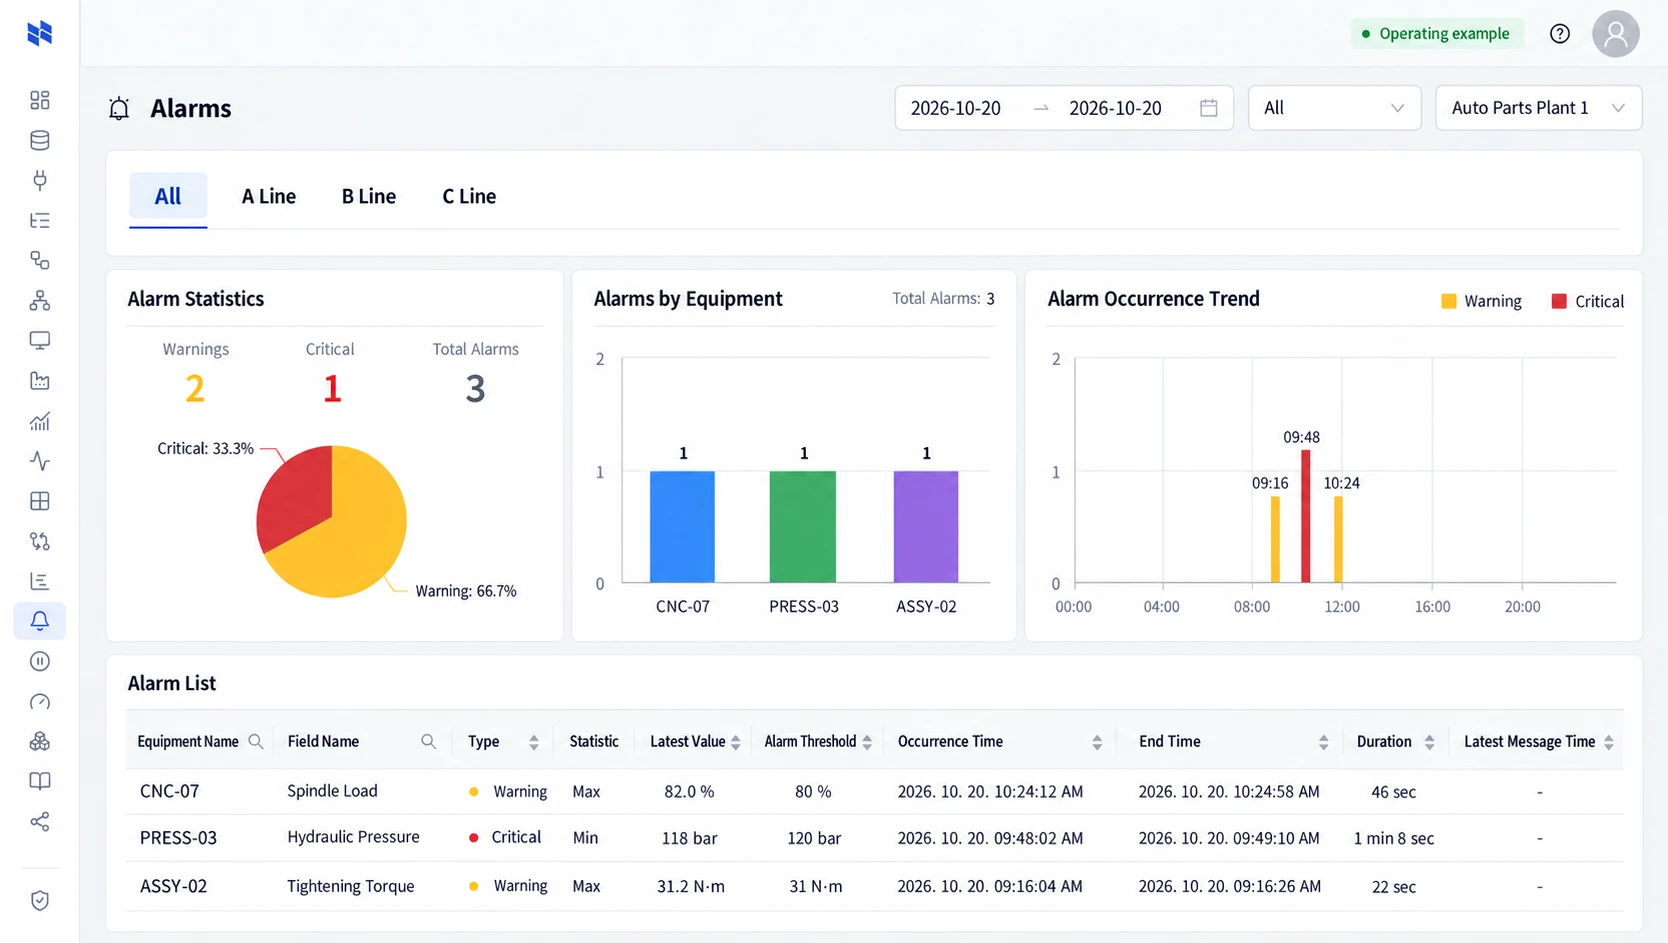
Alarms
Keep track of abnormal signals and events
Review alarms, onset and recovery times. Use recurrence and duration to prioritize equipment checks.
The same data, ready for the next task.
Start together
Tell us what you want to improve first.
Tell us about your equipment, data and priorities to review a path from connection to operations.