
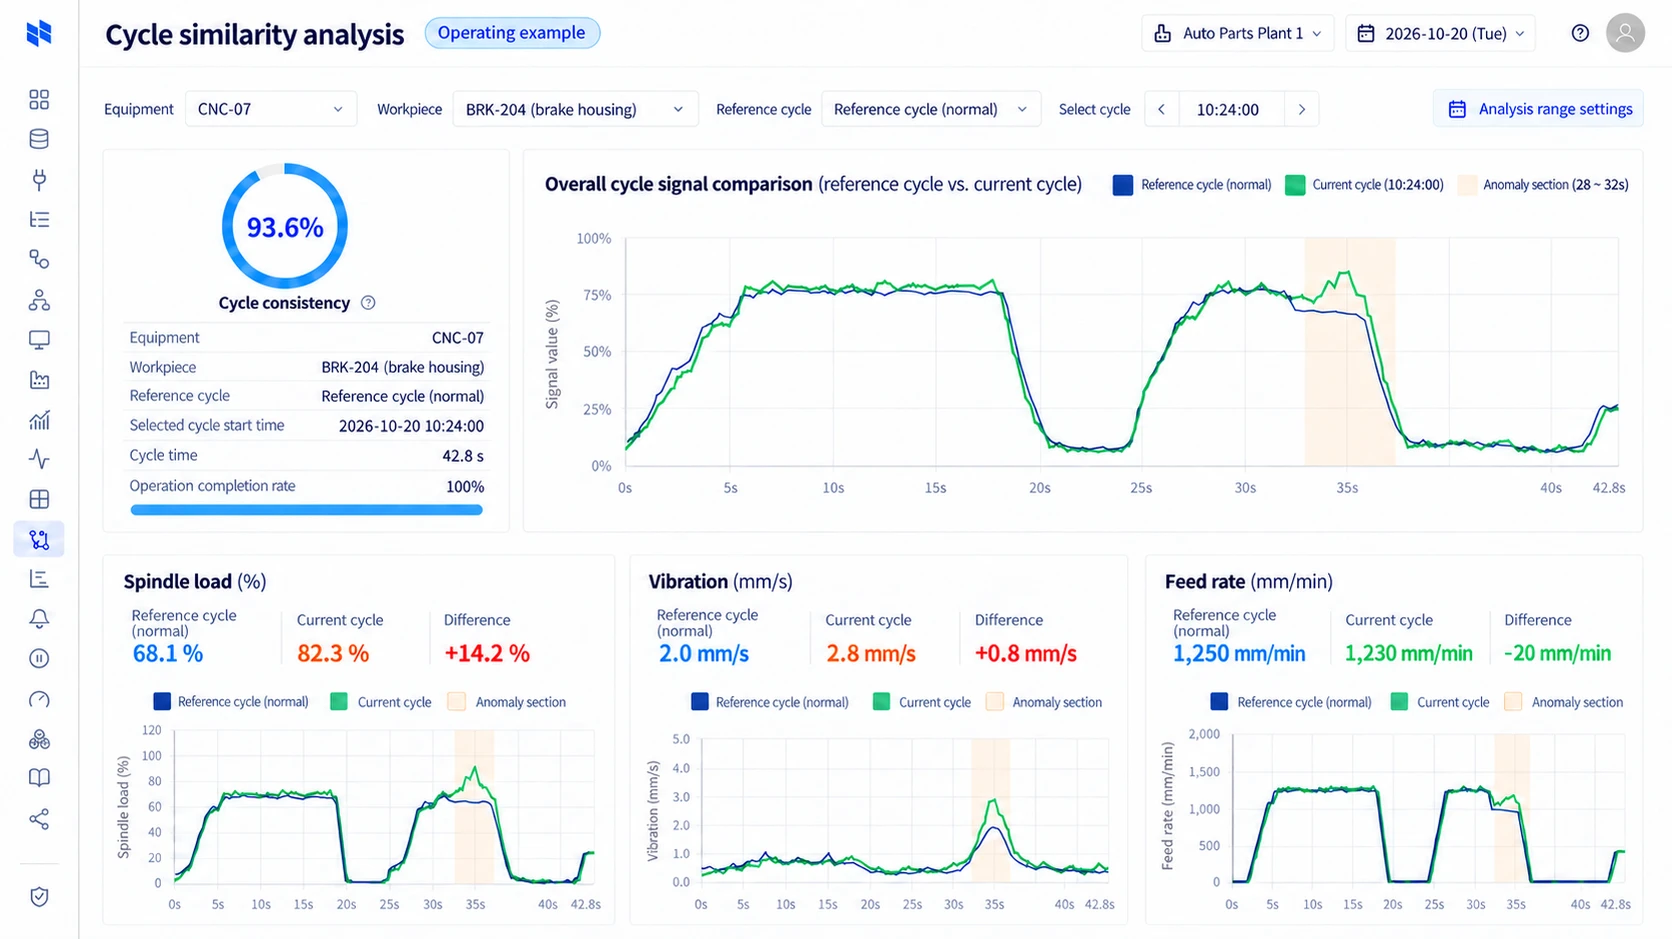
Choose a completed production cycle as the reference.
NAZARE · Cycle pattern comparison
Find the cycle that behaves differently.
Define each production cycle and compare its signals with a reference run. Find changed segments in repetitive production to prioritize quality checks and equipment inspection.
Keep data on siteStart small, expand as needed
What changes on the shop floor
Cycle pattern comparison
Adjust signal weights, tolerances and excluded segments.
Pattern differences help identify what to inspect; quality decisions also use inspection results.
Use files or analysis integrations to work with results in existing analytics tools.
NAZARE · Signal trend analysis
See how signals move together, beyond a single number.
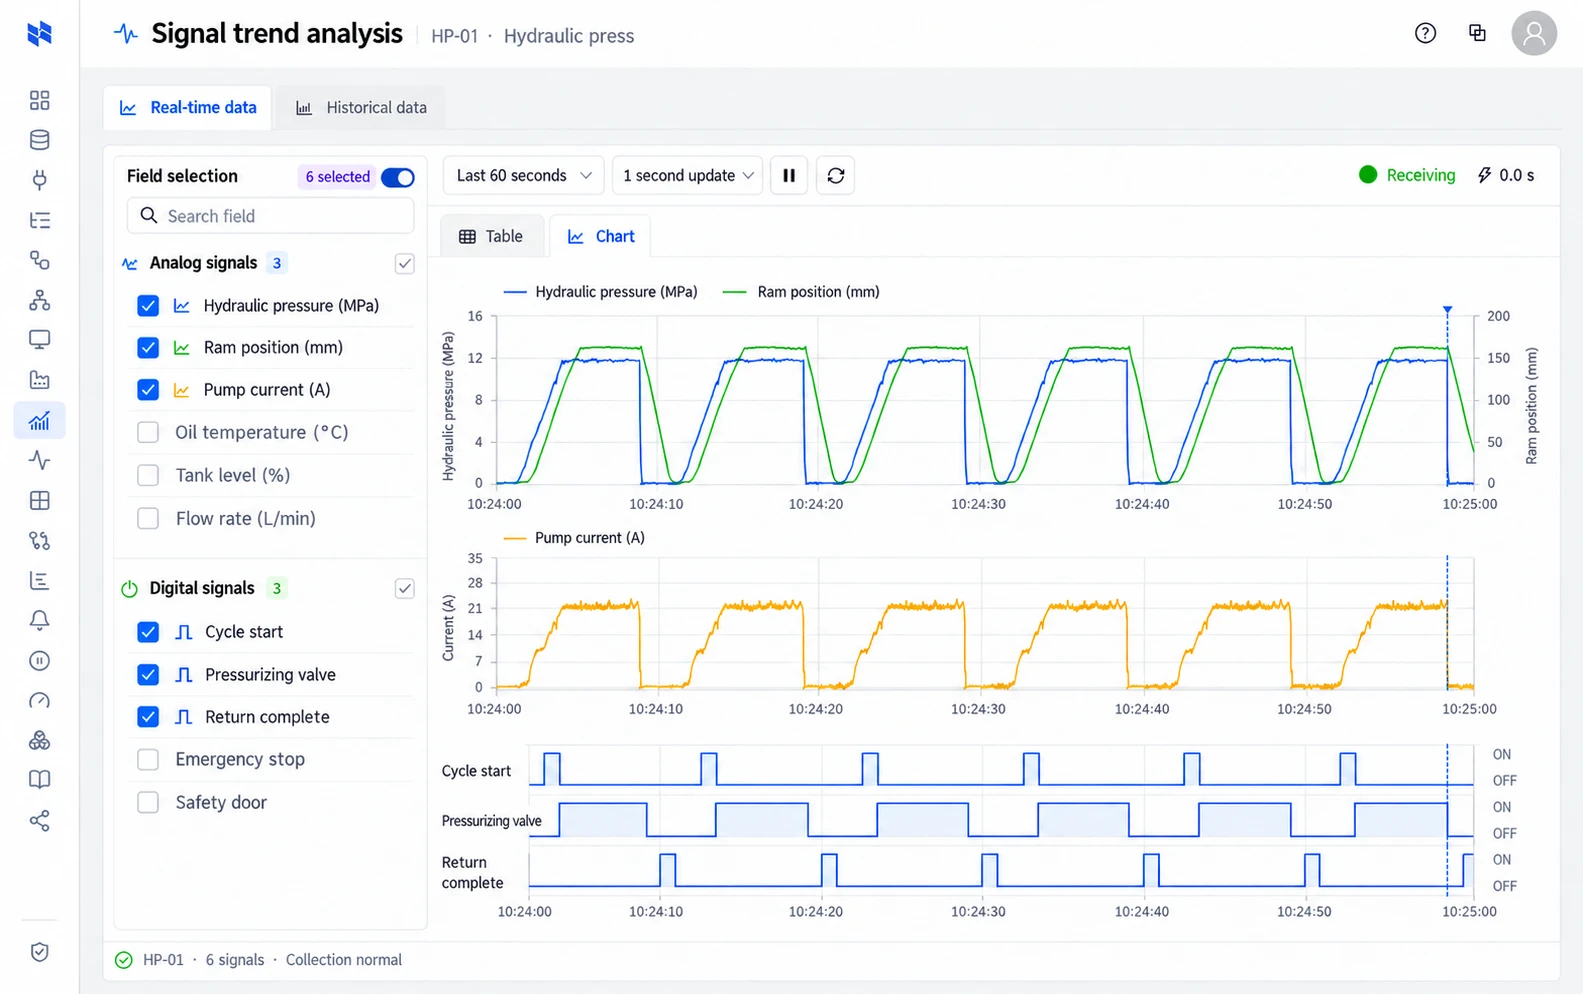
Live trends
Is every cycle following the same pattern?
Display pressure, position and current as analog traces, and contact states such as cycle start and valve operation as digital signals. Align signals on the same time axis to see how pressurization and feedback signals interact in real time.
- Signals grouped by machine
- Analog and digital together
- Repeated production-cycle patterns
Historical trends
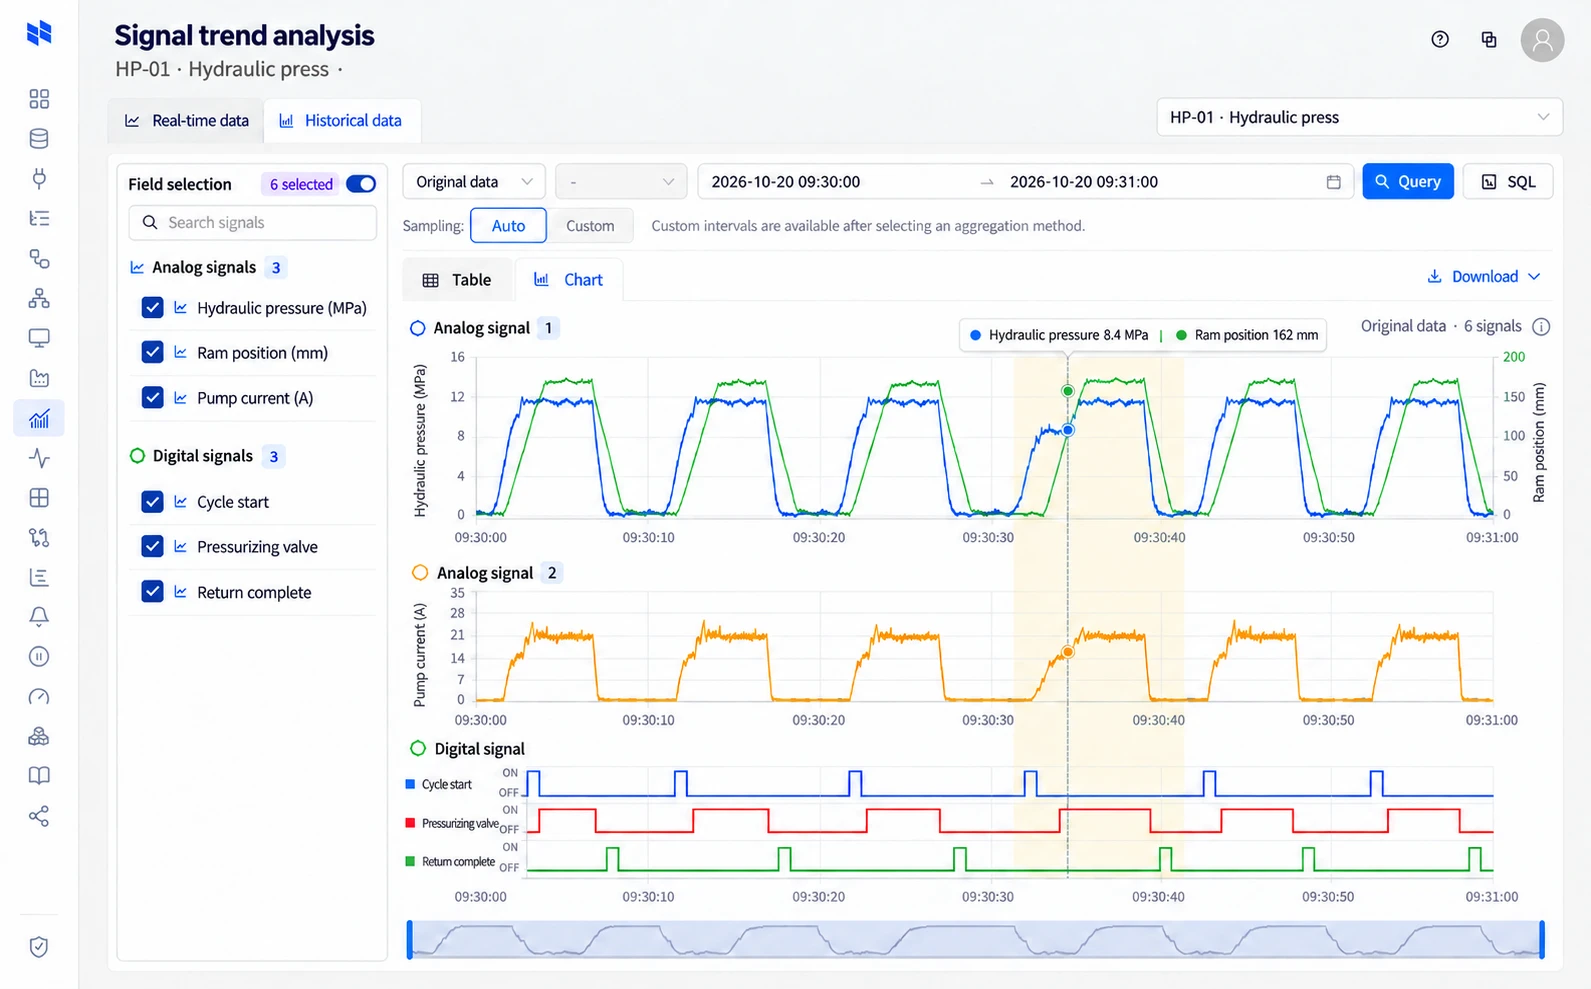
Revisit the signals behind one delayed cycle.
Load stored signals for a machine and time range. Compare when the valve switched with pressure rise and motor current, then zoom into the event to narrow down possible causes.
- History by machine and time range
- Compare signals at the same instant
- Zoom in and inspect original data
NAZARE
Explore the tools behind your daily operations.
From connections and analysis to maintenance and administration: see what each screen helps you do.
Put data to work on the shop floor
Cycle similarity analysis
Spot signal changes in repeated operations
When the same machine produces the same product, overlay current cycle signals with signals from earlier cycles that produced conforming parts and compare them in real time. Check signal deviations against tolerances to quickly identify machines needing inspection. Assess production-pattern similarity separately from the inspection pass rate.
Manage access and operating standards
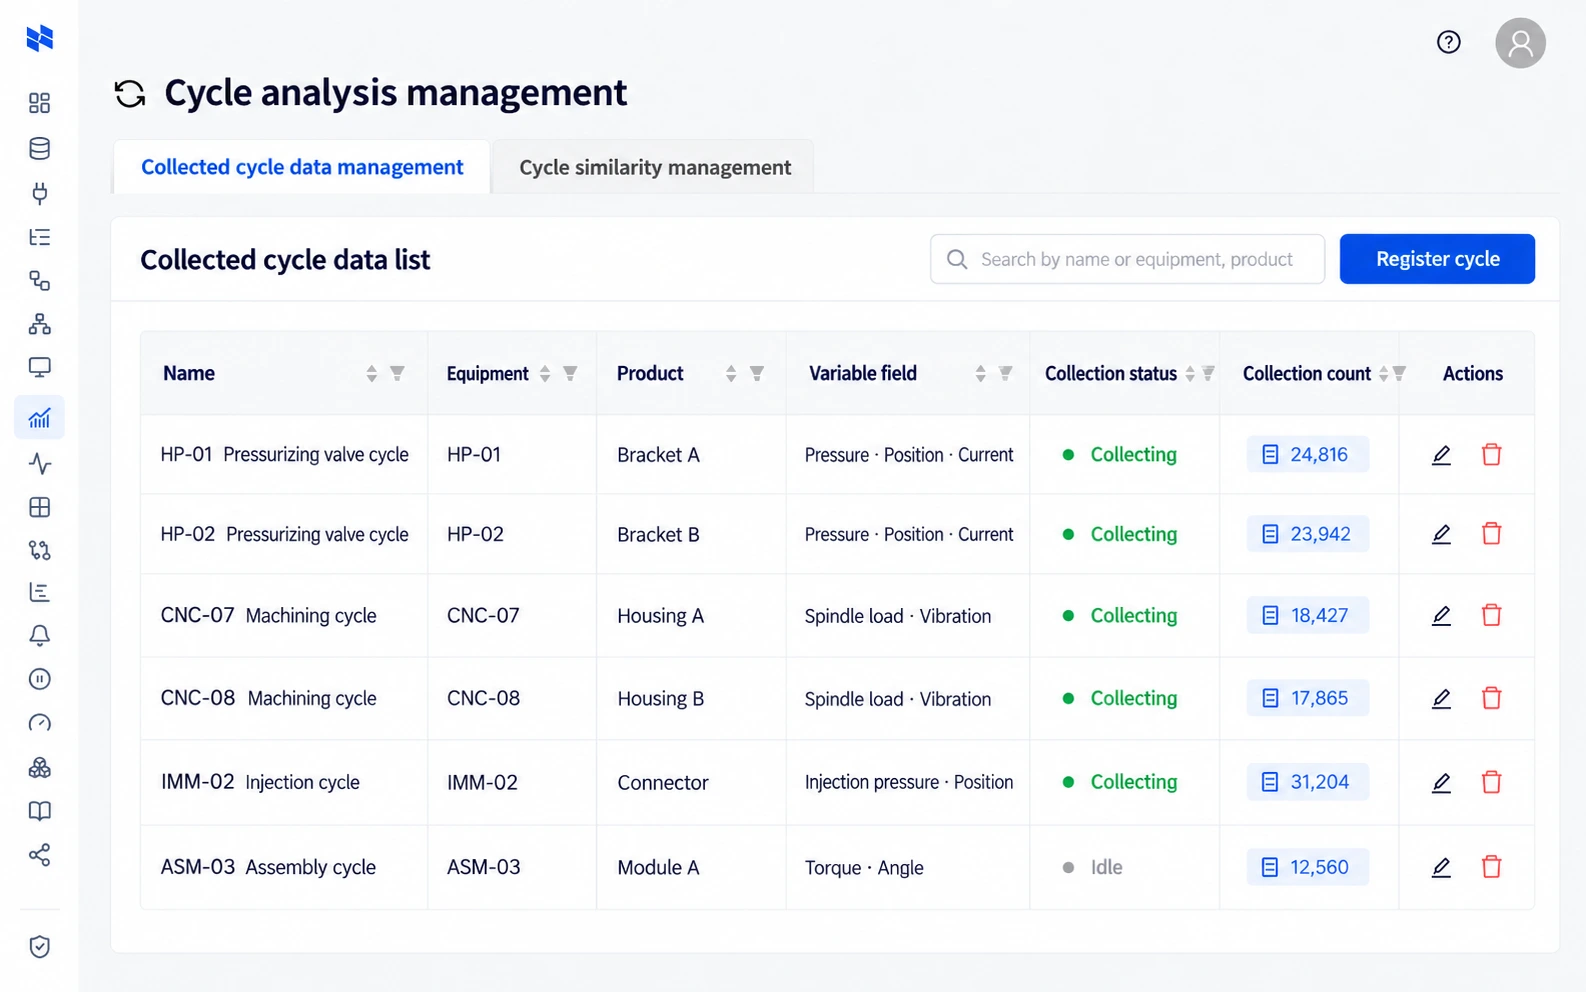
Cycle analysis setup
Define the boundaries of a production cycle
Manage cycle boundaries, reference cycles, tolerances and signal weights for each product and operation.
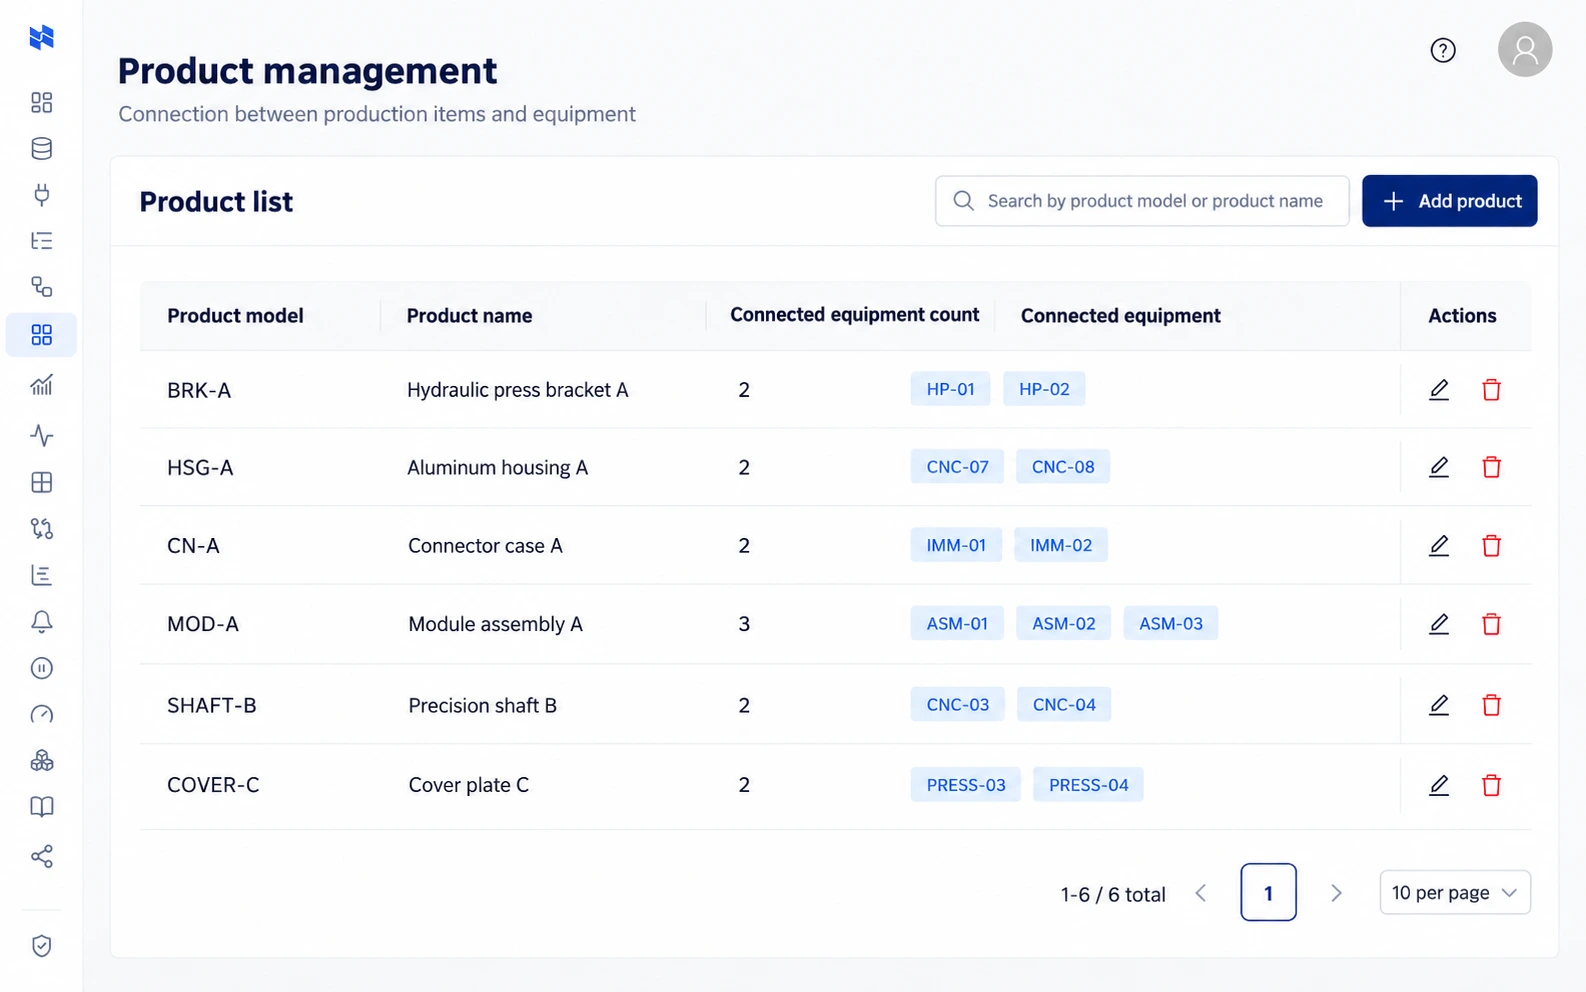
Product management
Connect products to machines and operating criteria
Register products and models and associate their equipment, so analysis follows the product being made.
Connection & operating details
Inspect precise records over a focused window and aggregate longer periods using averages, minima or maxima. The documented raw-data screen supports windows up to 24 hours; other analysis integrations are configured for the intended use.
The same data, ready for the next task.
Start together
Tell us what you want to improve first.
Tell us about your equipment, data and priorities to review a path from connection to operations.